02 Apr 2026
📊 XAU/USD Technical Analysis (4H)
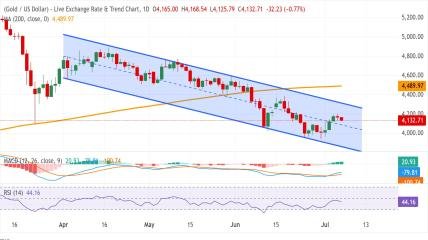
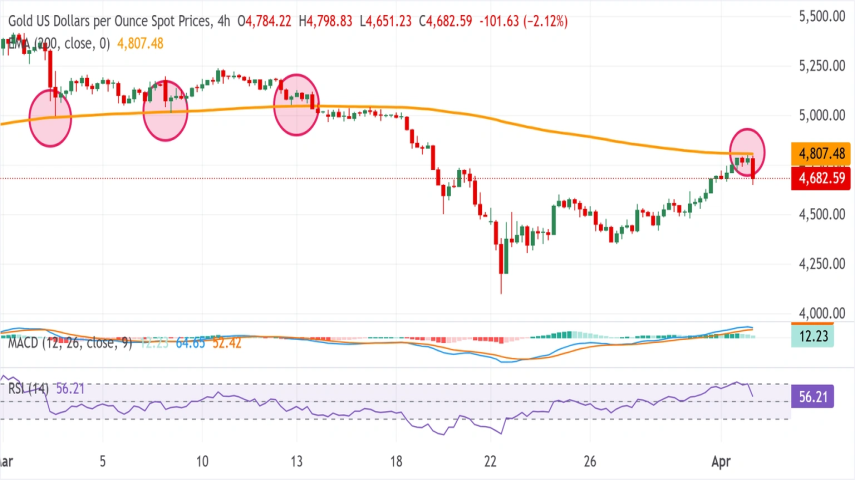
Gold (XAU/USD) is currently showing bearish pressure after a strong rejection near the $4,800 resistance zone, which aligns with the 200-period EMA on the 4-hour chart. This level has now flipped into a key resistance, giving sellers short-term control of the market.
Momentum indicators support this outlook. The Relative Strength Index (RSI) has declined from overbought levels above 70 toward the mid-range, indicating weakening bullish momentum. At the same time, the MACD is pulling back from recent highs, suggesting that upside strength is fading rather than continuing.
🔻 Bearish Scenario
A confirmed break below the $4,554 – $4,553 support zone could trigger further downside movement. In that case, price is likely to target:
- $4,500 – Key psychological level and demand zone
- $4,400 – Next major support if selling pressure increases
📈 Bullish Scenario
If buyers regain strength and push price above $4,765, we could see a short-term recovery toward:
- $4,820 – $4,830 – Strong resistance zone reinforced by the 200 EMA
🧠 Market Outlook
The overall structure suggests a bearish bias in the short term, with traders closely watching the $4,553 support level for confirmation of the next move.
🚀 Ready to Trade Gold Like a Pro?
Get access to high-accuracy XAU/USD signals, complete with:
✔️ Precise entry points
✔️ Stop Loss & Take Profit levels
✔️ Real-time market updates
✔️ Expert risk management
👉 Join our VIP Signals today and start trading with confidence 📊🔥
Don’t just watch the market — profit from it.
https://goldscalpingsignals.com/packages
Latest Posts