
06 Jul 2026
🟡 Gold (XAU/USD) Intraday Technical Analysis
🟡 Gold (XAU/USD) Intraday Technical Analysis
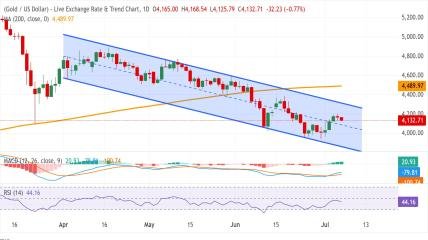
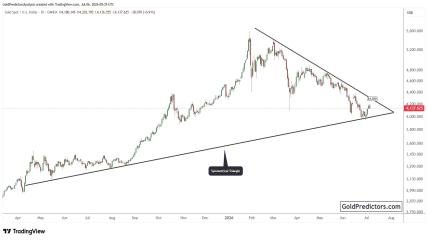
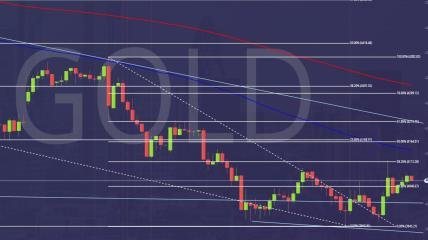
Gold is currently trading in a healthy consolidation phase following a strong bullish rally.
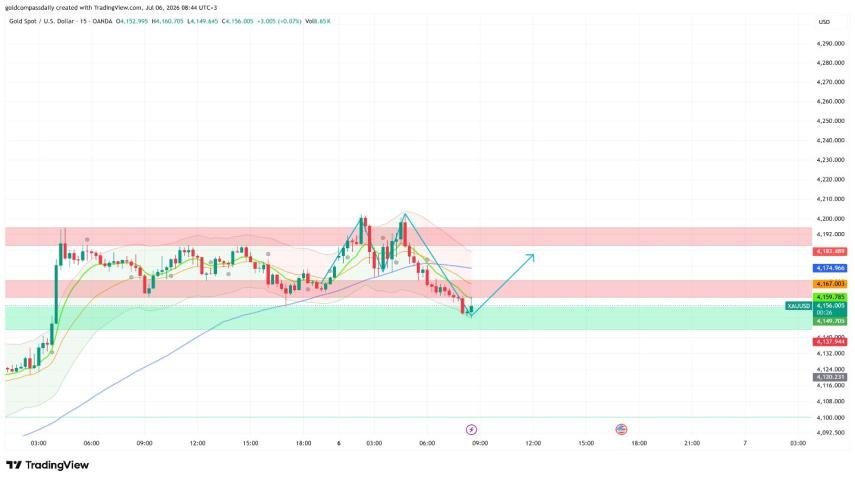
On the 15-minute chart, price surged from the $4,120 support area over the past two sessions, reaching an intraday high above $4,205 before facing selling pressure within the $4,192–$4,200 resistance zone.
The pullback has remained orderly, with buyers defending the $4,149–$4,159 demand zone.
Meanwhile, short-term moving averages are beginning to turn higher, indicating that the bullish momentum structure remains intact despite the recent correction.
If buyers maintain control, Gold could rebound toward $4,167, which serves as the first key intraday resistance. A successful break above this level would expose $4,183, followed by a retest of the $4,192 resistance area during the U.S. trading session.
However, a sustained move below $4,137 would invalidate the current bullish outlook and increase the likelihood of a decline toward $4,120.
📈 Bullish Scenario
Price holds above $4,149 during the U.S. session.
ISM Services PMI comes in below 54.0, supporting expectations of a softer U.S. dollar.
Initial upside target: $4,183
Extended target: $4,192
Additional dovish comments from Federal Reserve Governor Waller could support a move back toward $4,200.
📉 Bearish Scenario
A 15-minute candle closes below $4,137.
ISM Services PMI prints above 55.5, strengthening the U.S. dollar.
Initial downside target: $4,120
Extended downside target: $4,100
🎯 Key Levels
Resistance: $4,167 • $4,183 • $4,192 • $4,200
Support: $4,149 • $4,137 • $4,120 • $4,100
⚠️ Trade with proper risk management and wait for confirmation before entering any position, especially during high-impact U.S. economic news releases.
Check Free Signal Here: https://www.goldscalpingsignals.com/packages