
07 Jul 2026
Gold (XAU/USD) Technical Analysis: Bearish Trend Remains Below 200-Day SMA
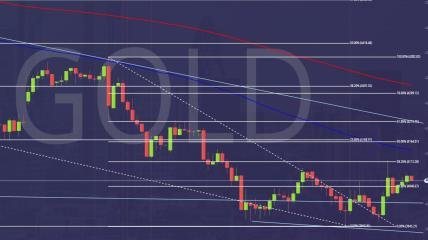
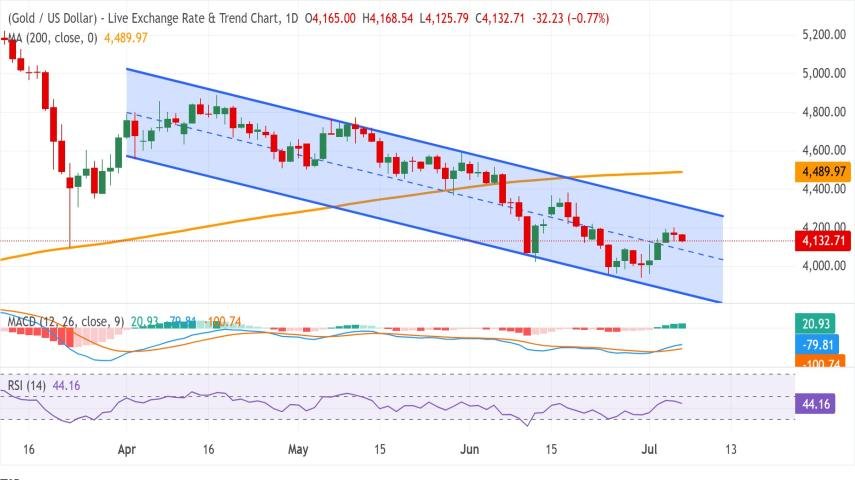
Gold (XAU/USD) continues to trade with a bearish near-term bias, remaining below the 200-day Simple Moving Average (SMA) at $4,489.97 and inside a well-defined descending channel. The prevailing trend still favors sellers, although recent price action suggests bearish momentum is beginning to ease.
The MACD has turned positive, with the MACD line crossing above the signal line and the histogram expanding into positive territory. This indicates that bullish momentum is gradually recovering. However, the Relative Strength Index (RSI) remains at 44.16, below the neutral 50 level, showing that buyers have yet to regain full control of the market.
On the downside, $4,100 serves as the first important support level. A break below this area could expose the lower boundary of the descending channel near $3,844.34, where stronger buying interest may emerge.
On the upside, Gold faces immediate resistance around the upper boundary of the descending channel near $4,296.64. A successful breakout above this level would shift attention toward the 200-day SMA at $4,489.97, followed by the next major resistance at $4,572.41.
📈 Bullish Scenario
MACD continues to strengthen and price breaks above $4,296.64.
Initial upside target: $4,489.97 (200-day SMA).
Extended target: $4,572.41.
📉 Bearish Scenario
Price remains below the descending channel resistance.
A break below $4,100 confirms renewed selling pressure.
Initial downside target: $3,844.34.
🎯 Key Levels
Resistance: $4,296.64 • $4,489.97 • $4,572.41
Support: $4,100.00 • $3,844.34
Risk Disclaimer: Trading Gold involves significant risk. Always use proper risk management and wait for confirmation before entering a position.
Check Live Signal Here:https://goldscalpingsignals.com/packages
Latest Posts