01 Jun 2026
📊 Gold (XAU/USD) Technical Analysis: Market Stays Vulnerable Below $4,600
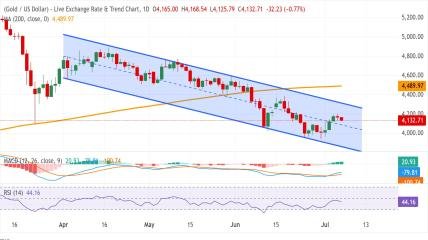
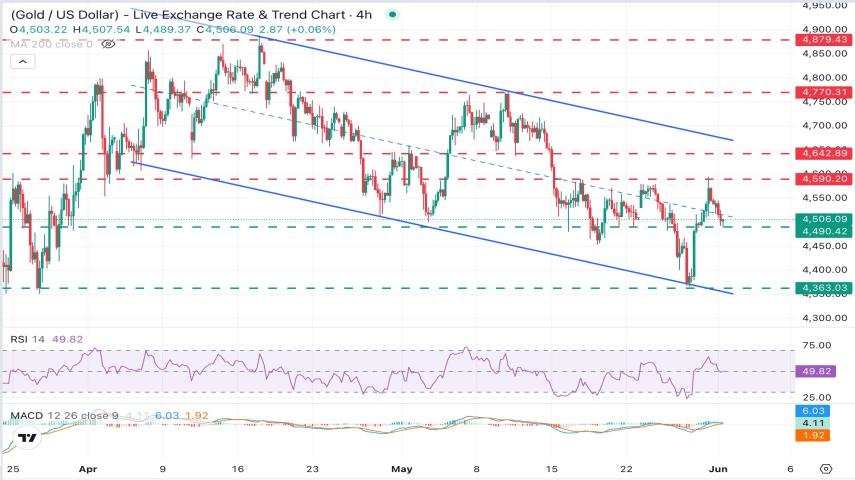
Gold (XAU/USD) is currently trading around $4,500, showing signs of continued weakness after repeated rejections from the $4,590 resistance zone. Despite earlier attempts to extend the bullish recovery, the market remains capped below key technical barriers, suggesting that bullish momentum is gradually fading in the short term.
📉 Market Overview
On the 4-hour timeframe, Gold shows a mixed but slightly bearish structure as price action continues to struggle near resistance levels.
Momentum indicators are also reflecting this indecision:
The Relative Strength Index (RSI) is hovering near the neutral level around 50, indicating a balance between buyers and sellers.
The MACD indicator is flattening near the zero line, suggesting weakening momentum and lack of strong directional conviction.
Overall, the market is currently in a consolidation phase, with a slight downside vulnerability emerging after multiple failed breakout attempts.
🔻 Key Resistance Zone: $4,590
The $4,590 area remains the most important short-term resistance level for Gold.
This zone has been tested multiple times (May 19, 25, 26, and 29 highs), but each attempt has resulted in rejection. This repeated failure highlights strong selling pressure at higher levels.
📌 A confirmed break above $4,590 would be required to:
Restore bullish confidence
Open the path toward $4,645
Extend gains toward $4,670 (channel resistance)
Until then, upside movements are likely to remain limited and corrective in nature.
🔽 Key Support Levels
On the downside, sellers are gradually gaining control as price weakens below resistance.
Immediate Support:
$4,490 (Friday’s low)
This is the first key level where buyers may attempt to defend the trend.
Major Support:
$4,365 (May 28 low)
A break below this level would signal a deeper bearish correction and confirm stronger downside momentum.
⚠️ Market Outlook
Gold is currently in a fragile technical position, where both bullish and bearish forces are temporarily balanced, but with a slight bearish tilt.
As long as price remains below $4,590, the market structure suggests:
Limited upside potential
Increased risk of downside continuation
Ongoing consolidation or bearish pressure
However, traders should be cautious, as volatility may increase once price approaches either support or resistance zones.
📊 Trading Scenario Summary
🔼 Bullish Scenario
A breakout above $4,590 may trigger:
Move toward $4,645
Extension toward $4,670
Shift in momentum back to bullish control
🔽 Bearish Scenario
A breakdown below $4,490 may lead to:
Test of $4,365
Stronger bearish continuation
Increased downside momentum
💡 Final Thoughts
Gold remains in a range-bound but vulnerable structure, with sellers currently showing more control near resistance. Traders should avoid chasing price and instead wait for confirmation at key levels before taking positions.
🚀 Premium Trading Access
For traders who want real-time Gold signals, precise entry setups, and professional market analysis, our Premium Trading Group offers:
✔ High-probability XAU/USD setups
✔ Real-time trade alerts
✔ Risk-managed strategies
✔ Professional market breakdowns
👉 Upgrade to Premium and trade Gold with more confidence, structure, and consistency.
Latest Posts