11 Mar 2026
gold-xauusd-technical-analysis-11-feb-2026
Overview:
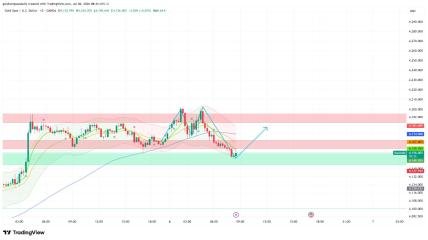
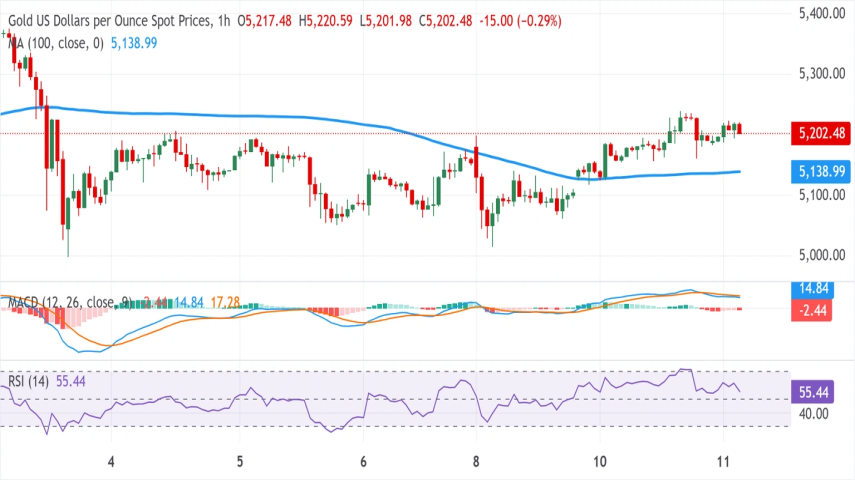
Gold remains supported after breaking above the 100-hour Simple Moving Average (SMA) and the $5,200 level, giving bulls short-term control. However, momentum indicators suggest buying pressure is cooling. Technical Indicators: MACD: Below signal line with negative histogram – upside momentum fading. RSI (14): Dropped from overbought above 70 to mid-50s – suggesting a possible short-term pullback.
Key Levels:
Resistance: $5,228
Next Target: $5,260
Support: $5,190
Major Support: $5,160
Market Outlook:
Holding above $5,190 keeps the bullish structure intact and could allow another test of $5,228. A break above $5,228 may open the path toward $5,260. A drop below $5,160 would weaken the bullish outlook and expose $5,140.
VIP Signals Reminder: Get daily gold scalping signals with entry, stop loss, and take-profit levels so you never miss high-probability trades.
Latest Posts