31 Mar 2026
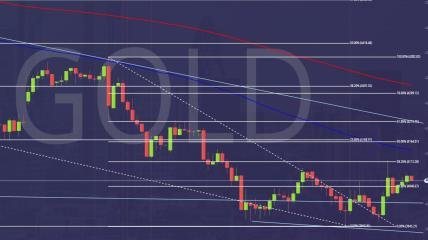
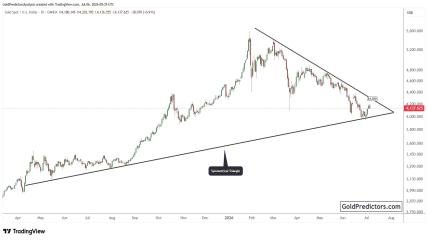
Gold (XAU/USD) Ready to Explode – Key Levels to Watch Now
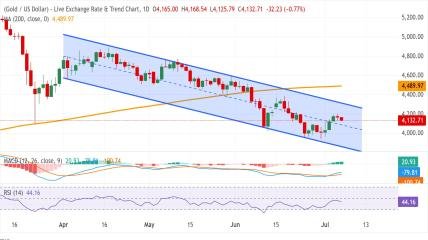
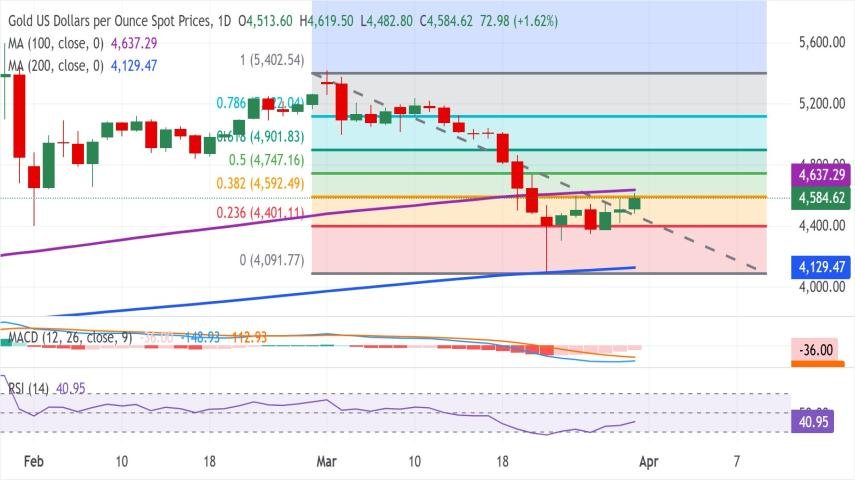
Gold is currently showing mixed momentum as price trades below the 100-day SMA, signaling short-term pressure while maintaining a broader bullish structure. 📉📈
🔍 Technical Overview:
Price holding below 38.2% Fibonacci retracement → short-term bearish bias
100-day SMA acting as resistance
200-day SMA trending upward → long-term bullish structure intact
RSI at 41 → weak bullish momentum
MACD below zero → bearish pressure still active
🎯 Key Levels to Watch
🔺 Resistance:
4,592 → 38.2% Fibonacci
4,637 → 100-day SMA
4,747 → 50% Fibonacci (major recovery level)
🔻 Support:
4,470 → recent lows
4,401 → 23.6% Fibonacci
4,200 – 4,150 → strong demand zone
4,129 → 200-day SMA (major support)
⚖️ Market Outlook
As long as price holds above 4,401 & 200-day SMA, the bullish structure remains valid.
However, failure below this zone could trigger strong bearish continuation. ⚠️
🚨 Trader Insight
This is a decision zone for GOLD.
Smart traders are waiting for:
✔ Break above resistance → BUY continuation
✔ Break below support → SELL confirmation
👉 VIP members will receive confirmed entries with exact TP & SL
Join Here👉 https://goldscalpingsignals.com/packages
Latest Posts