16 Mar 2026
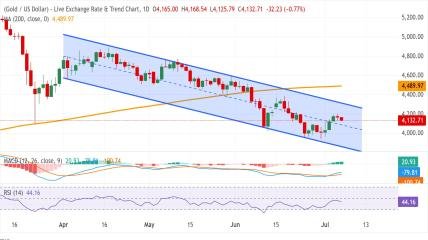
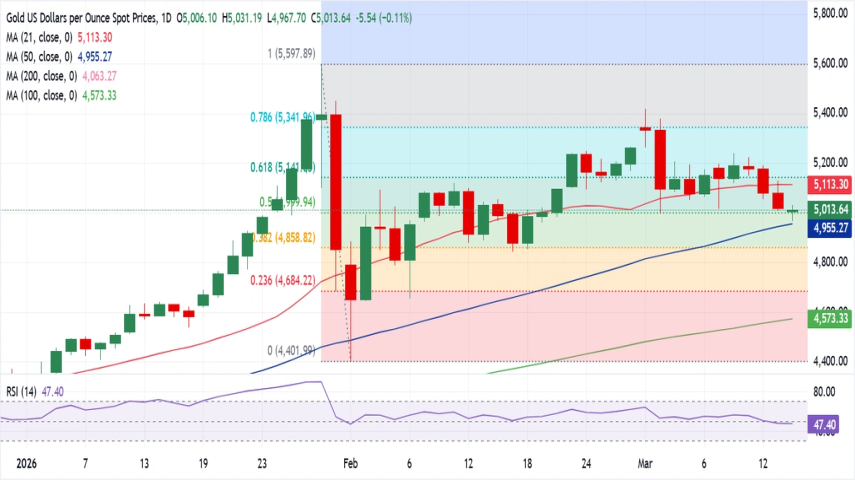
Gold remains in a mild bullish trend, holding above key moving averages.
🔹 Trend Overview
Price is trading above the 50-day SMA at $4,955
Still well above the 100-day SMA ($4,575) and 200-day SMA ($4,060)
This confirms the overall uptrend remains intact
🔹 Momentum
RSI at 47 indicates neutral momentum
Market is currently cooling and consolidating, not reversing
🔹 Key Support Levels
$5,000 – Major psychological support (50% Fibonacci)
$4,859 – Strong support zone (38.2% Fibonacci)
$4,950 – $4,575 – Strong demand zone with moving averages
🔹 Key Resistance Levels
$5,115 – Immediate resistance (21-day SMA)
$5,141 – Key Fibonacci resistance (61.8%)
$5,342 – Major breakout level (78.6%)
🚀 Bullish Scenario
If Gold breaks $5,141, momentum could push price toward $5,342 and potentially retest the $5,598 high.
⚠️ Bearish Scenario
Failure to hold $5,000 may lead to a deeper pullback toward $4,859.
🔥 Trader Tip:
Gold is currently consolidating inside an uptrend, so watch for breakouts above $5,141 or breakdowns below $5,000 for the next strong move.
Subscribe our VIP now For the Best Setup
Latest Posts