08 May 2026
📊 GBP/USD Technical Analysis – Bulls Eye Higher Levels
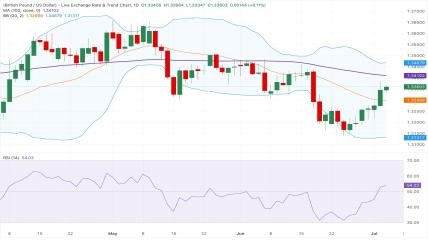
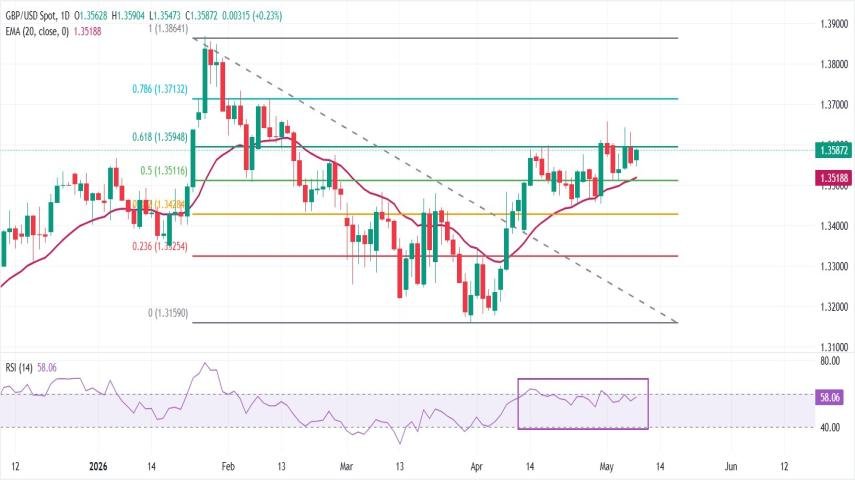
GBP/USD continues trading with a bullish tone around the 1.3590 region as buyers maintain control above important technical support zones. The pair remains comfortably above the 20-day Exponential Moving Average (EMA) at 1.3519, reinforcing positive momentum in the short-term trend.
The current price action is approaching a critical resistance area near the 61.8% Fibonacci retracement level at 1.3595. A confirmed breakout above this zone could trigger additional upside momentum toward the next major resistance at 1.3713, followed by the recent swing high around 1.3864.
📈 Bullish Scenario
As long as GBP/USD remains above the 1.3519 support area, buyers may continue pushing the market higher. Momentum indicators also remain supportive, with the Relative Strength Index (RSI) holding near 58, suggesting bullish pressure without overbought conditions.
📉 Bearish Scenario
Failure to break above 1.3595 could lead to temporary pullbacks toward 1.3519 and 1.3512 support zones. A deeper correction may expose 1.3428 and 1.3325 if bearish pressure increases.
🔑 Key Technical Levels
Resistance: 1.3595
Target 1: 1.3713
Target 2: 1.3864
Support: 1.3519
Lower Support: 1.3428
💡 Traders should monitor price behavior closely around the 1.3595 resistance zone for confirmation of the next major move.
🚀 Stay connected with our platform for more live forex analysis, XAUUSD updates, and high-probability trading signals.
Latest Posts