13 May 2026
GBP/USD Daily Technical Analysis
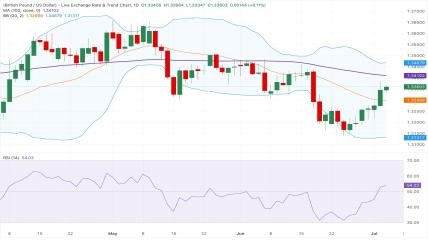
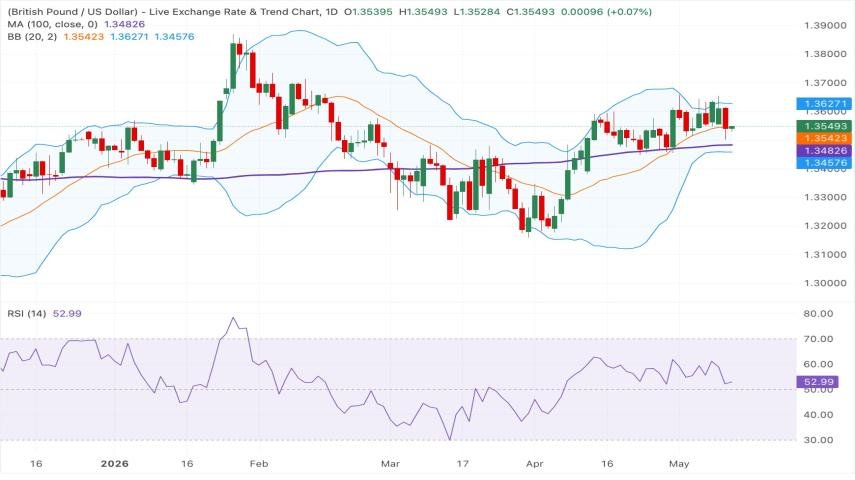
GBP/USD maintains a mildly bullish outlook on the daily timeframe as price action continues to hold above the 20-day Bollinger Simple Moving Average (SMA) and well above the 100-day SMA, reflecting ongoing dip-buying interest and a stable upward structure.
Momentum indicators remain supportive, with the Relative Strength Index (RSI) trading around the mid-50 region, suggesting balanced bullish momentum without signaling overbought conditions. Price continues to advance gradually within the Bollinger Bands, indicating controlled upside pressure.
Key Resistance Levels
The pair faces immediate resistance near the upper Bollinger Band around 1.3630. A decisive break above this level could strengthen bullish momentum and expose higher upside targets in the near term.
Key Support Levels
Initial support is located near the 20-day Bollinger SMA at 1.3540, which continues to act as a dynamic support zone. Further downside protection is seen at the 100-day SMA around 1.3483. In the event of a deeper correction, the lower Bollinger Band near 1.3458 may provide stronger technical support.
Outlook
Overall, GBP/USD remains supported by a constructive technical structure while trading above key moving averages. However, buyers may need stronger momentum to sustain gains beyond the 1.3630 resistance zone.
Latest Posts