16 Mar 2026
EUR/USD Technical Snapshot: Key Levels to Watch
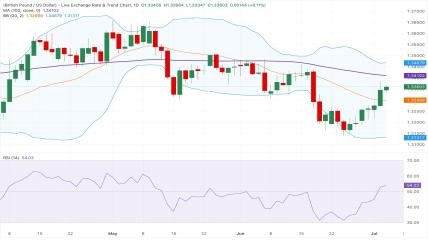
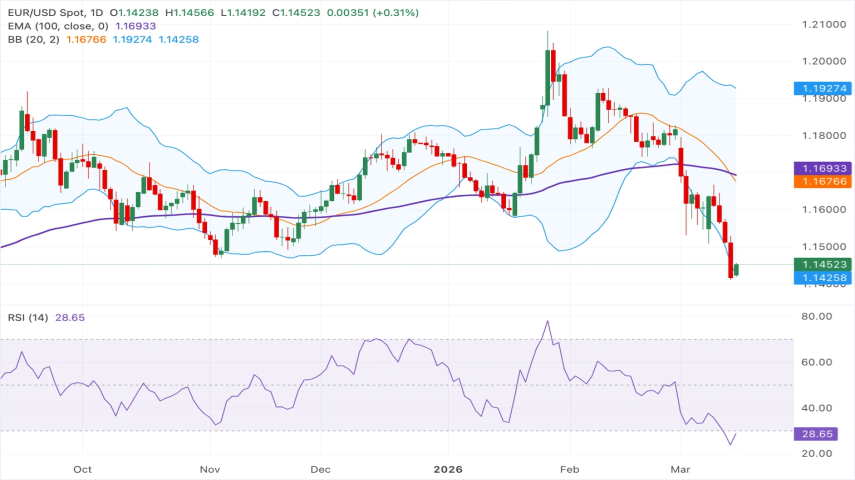
On the daily chart, EUR/USD remains bearish in the near term. Price is trading well below the 100-day EMA, which has started to flatten after a recent peak, and has broken beneath the lower Bollinger Band, continuing along the downside of the envelope. This shows that sellers are still firmly in control.
The RSI sits in oversold territory after sliding from mid-range readings, confirming strong downside momentum. The pair remains stretched below the 20-day Bollinger midpoint near 1.1700, indicating limited upward strength in the short term.
Key Levels:
Resistance: 1.1510 (recent recovery high), 1.1620 (convergence of 100-day EMA and 20-day Bollinger middle band)
Support: 1.1415 (recent close low), 1.1360 (next target along lower Bollinger Band trajectory)
As long as EUR/USD stays capped below 1.1620, any rallies are expected to encounter selling pressure, keeping the focus on lower support zones for potential downside continuation.
🔥 Want real-time EUR/USD signals like this daily?
Join our Premium Signals and get:
✅ Accurate entry points
✅ Stop Loss & Take Profit levels
✅ Daily Forex analysis
👉 Subscribe now: https://goldscalpingsignals.com/packages
Trade smart. Stay ahead of the market. 🚀
Latest Posts