
04 Nov 2025
📊 Dow Jones (DJIA) Technical Analysis
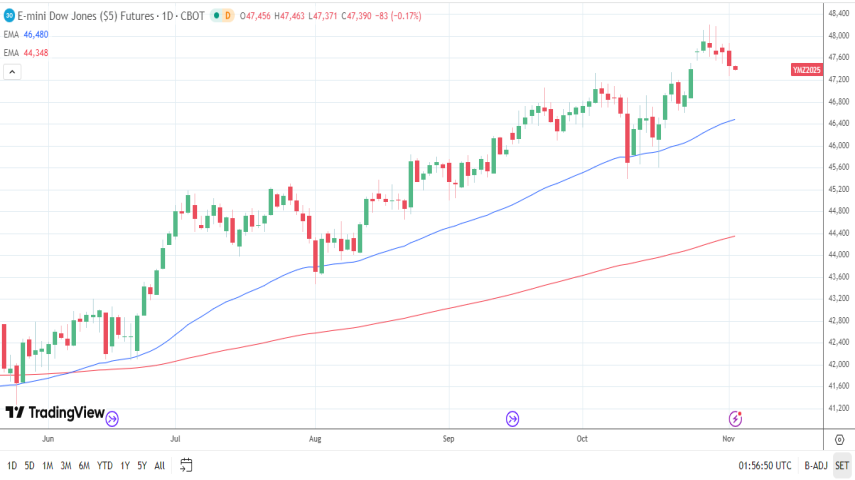
The Dow Jones Industrial Average trades above key support levels, maintaining a bullish bias as markets digest economic data and Fed signals. Traders should monitor the following critical levels:
🔹 Resistance
47,500
48,000
October 28 record high: 48,214
🔹 Support
47,000
50-day EMA: 46,480
The daily chart signals bullish momentum, with potential upside if the index breaks above 48,000–48,214. Conversely, a drop below 47,000 could trigger short-term corrective pressure.
💡 Technical Summary:
Key Resistance: 47,500 / 48,000 / 48,214
Key Support: 47,000 / 50-day EMA 46,480
Bias: Neutral-to-Bullish while above 47,000
Next Move: Watch for a breakout above 48,000 or a pullback toward 47,000
Choose your package now🔥
Latest Posts