13 Mar 2026
📊 AUD/USD Technical Outlook – Bulls Still in Control
Daily Chart Analysis
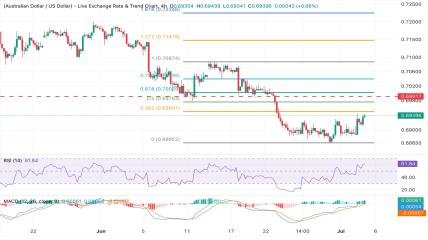
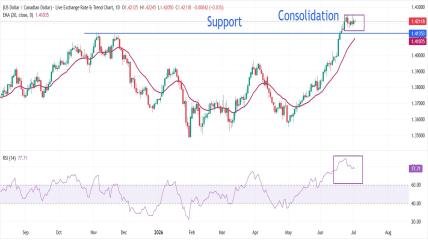
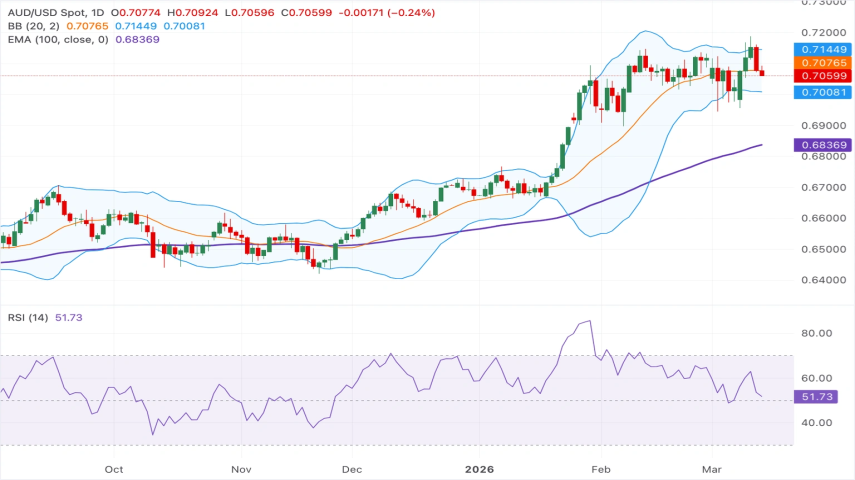
The near-term bias for AUD/USD remains mildly bullish as price continues to trade above the rising 100-day EMA, signaling sustained upside momentum. The pair is currently consolidating just below recent highs, suggesting the market may be preparing for the next directional move.
Price action has been clustering in the upper half of the Bollinger Bands, while the bands themselves have started to flatten. This indicates that although the bullish trend remains intact, upside momentum is beginning to moderate rather than accelerate sharply.
Meanwhile, the RSI has cooled from overbought levels above 70 to around the mid-50s, showing that bullish pressure still exists but with reduced intensity following the strong rally earlier this month.
📉 Key Support Levels •
0.7020 – Recent consolidation
support • 0.6950 – Lower Bollinger Band region •
0.6900 – Major support zone •
0.6840 – 100-day EMA support
📈 Key Resistance Levels •
0.7120 – Recent closing high •
0.7150 – Short-term resistance •
0.7200 – Upper Bollinger Band stretch level
⚡ Trading Outlook
As long as AUD/USD holds above 0.7020, the bullish structure remains intact. A breakout above 0.7120–0.7150 could open the door toward 0.7200, while a break below 0.7020 may trigger a deeper pullback toward 0.6950.
💌 Want real-time Forex trading signals and setups?
Join our VIP alerts 👉 https://goldscalpingsignals.com/packages 🚀📩
Latest Posts