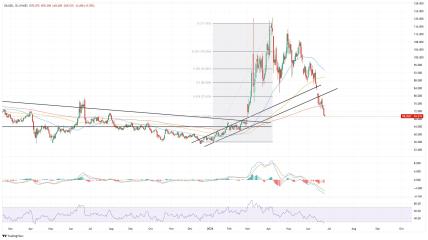
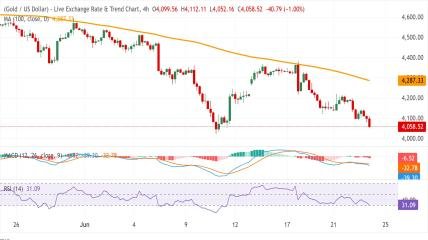
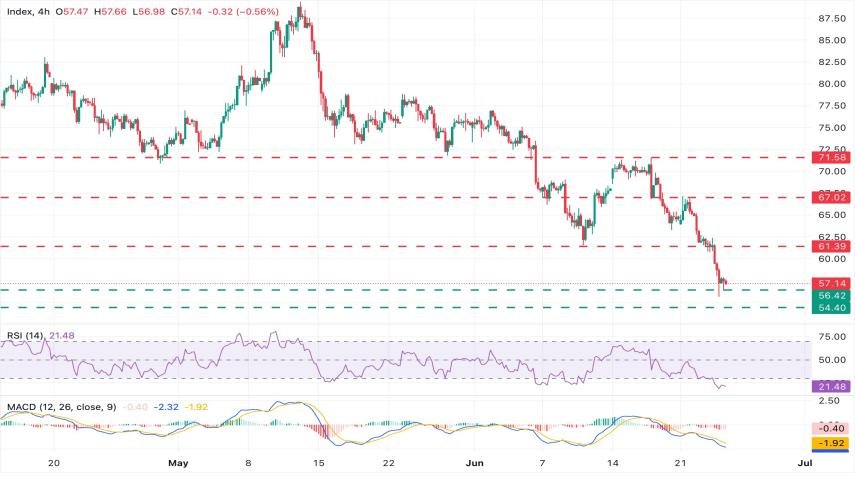
XAG/USD trades around $57.14, maintaining a bearish near-term bias as price continues to extend its downside momentum. The market is currently showing signs of exhaustion, with intraday indicators suggesting that the recent decline may be overstretched.
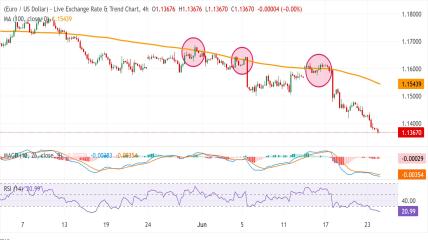
The 4-hour Relative Strength Index (14) is hovering near 20, firmly in oversold territory. At the same time, the MACD histogram remains negative but is gradually converging toward the zero line, indicating that bearish momentum is weakening and sellers may be losing strength.
Despite this, price action remains under pressure, with sellers still in control until a clear reversal signal emerges.
🟢 Key Support Levels
$56.45 → December 4, 2025 low (immediate support holding bears for now)
A break below this level would open room for further downside toward:
Mid $54.00s → prior major support zone (October–November 2025 structure)
$48.64 → November 21, 2025 low (major long-term downside extension level)
🔴 Key Resistance Levels
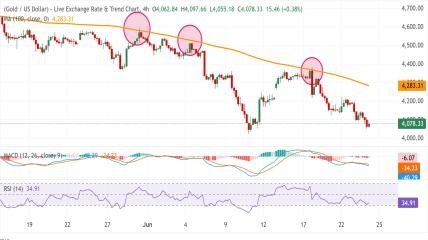
$61.40 → former support now acting as resistance (first recovery barrier)
$67.00 → June 22 high (major swing resistance)
$71.60 → June 17 high (upper structural resistance)
📉 Market Outlook
XAG/USD remains in a bearish structure in the short term; however, deeply oversold RSI conditions suggest that downside momentum may be nearing exhaustion. This increases the probability of a technical correction or consolidation phase before any potential continuation of the broader trend.
Traders should closely monitor the $56.45 support zone, as a decisive break below it would confirm renewed bearish expansion, while holding above it may trigger a relief bounce toward resistance levels.