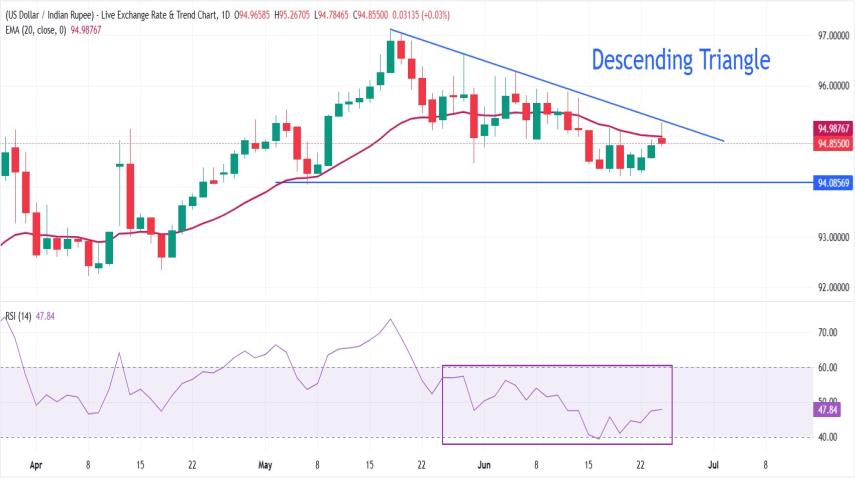
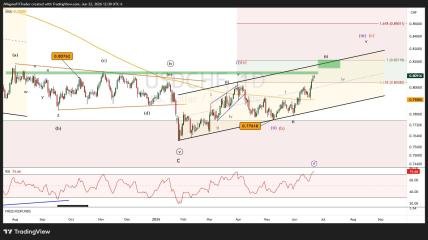
USD/INR is showing signs of recovery as the pair trades around 94.85, attempting to push above a key descending resistance line that has capped prices for several weeks. Despite the recent bounce, the broader technical structure remains cautious as sellers continue to defend major resistance levels.
Traders are closely watching whether the pair can sustain momentum above the 20-day Exponential Moving Average (EMA), which currently acts as a significant barrier.
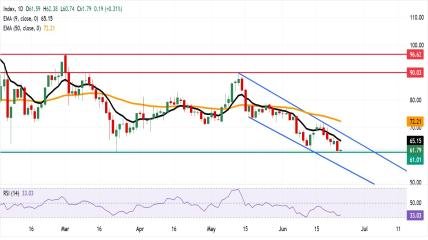
Technical Analysis The short-term trend remains under pressure while USD/INR trades below key resistance zones. The 20-day EMA near 95.00 continues to cap upside attempts, while a descending trendline extending from the yearly high at 97.12 reinforces the bearish structure. Meanwhile, the Relative Strength Index (RSI) is currently at 47.84, remaining below the neutral 50 level. This suggests that bearish momentum still exists, although sellers are losing some strength.
Key Levels to Watch Bullish Scenario 📈 Resistance 1: 95.00 📈 Resistance 2: 95.29 📈 Resistance 3: 97.12 A successful breakout above 95.29 could signal stronger bullish momentum and attract additional buying pressure. Bearish Scenario 📉 Support 1: 94.03 📉 Support 2: 93.46 A break below 94.03 would strengthen the bearish outlook and expose the April support region near 93.46.
Market Outlook USD/INR remains at a critical technical crossroads. Buyers are attempting to challenge the descending resistance structure, but confirmation is still required. A move above 95.00 and 95.29 could improve sentiment significantly, while failure to break higher may allow sellers to regain control and push prices back toward key support levels.
Traders should closely monitor price action around the 95.00 area, which is likely to determine the next directional move.