02 Apr 2026
📊 XAU/USD (Gold) Technical Analysis – 4H Chart
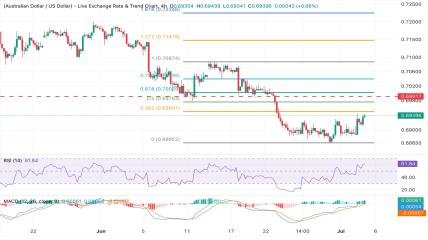
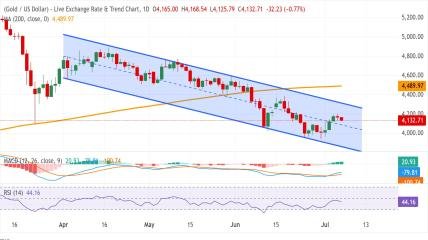
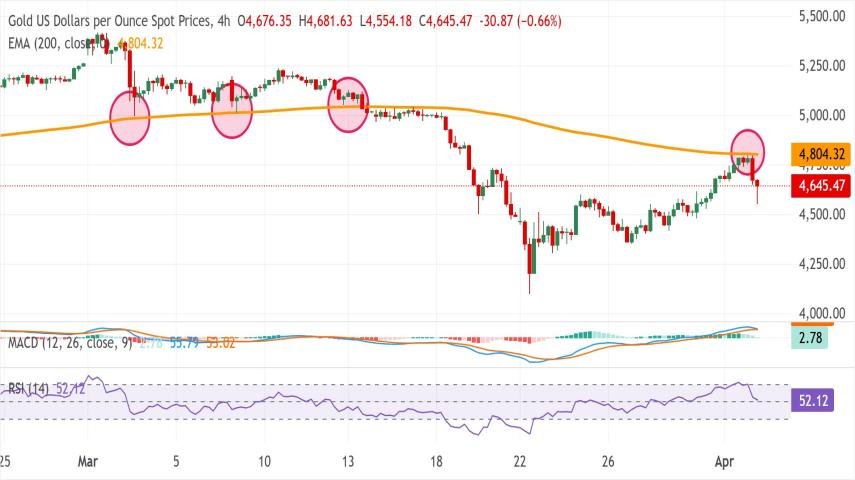
Gold (XAU/USD) remains under bearish pressure after a strong rejection near the $4,800 resistance zone, which aligns with the 200-period EMA on the 4-hour chart. This level has now flipped into a key technical barrier, reinforcing downside risk in the short term.
Momentum indicators are also supporting this outlook. The RSI has cooled from overbought levels above 70 to around 52, indicating that bullish momentum has normalized and sellers may begin to regain control if pressure continues.
Meanwhile, the MACD is pulling back toward its signal line while still in positive territory, suggesting that bullish momentum is weakening rather than fully reversing.
🔻 Bearish Scenario
A confirmed break below the $4,554 – $4,553 support zone would signal stronger downside continuation, opening the path toward:
$4,520 – First downside target
$4,440 – Extended bearish target
$4,360 – Deeper consolidation zone
📈 Bullish Scenario
For buyers to regain control, price must reclaim key resistance levels:
$4,700 – Immediate resistance
$4,750 – Strong rejection zone
$4,800 – 200 EMA (major trend barrier)
A break above $4,800 would challenge the current bearish structure and shift momentum back toward buyers.
🧠 Market Outlook
Overall, the market remains in a corrective bearish phase, with traders watching closely for a confirmed breakdown or reversal around key support and resistance zones.
🚀 Trade Gold Like a Pro
Get access to VIP trading signals with precision entries, including:
✔️ Real-time XAU/USD updates
✔️ Exact entry, SL & TP levels
✔️ Risk-managed trading strategies
✔️ High-probability setups daily
👉 Join our VIP signals today and stay ahead of every market move 📊🔥
Don’t just analyze the market — profit from it consistently 💼📉📈
https://goldscalpingsignals.com/packages
Latest Posts