

04 Nov 2025
🛢️ WTI Crude Oil Technical Analysis
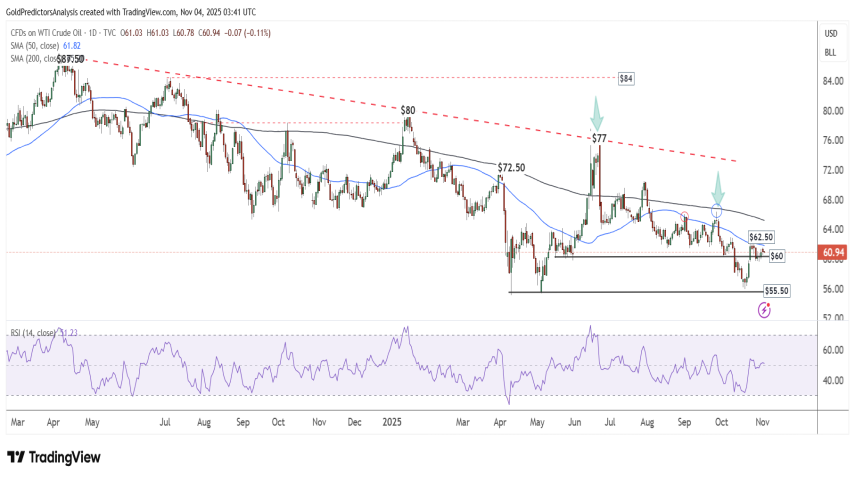
📊 WTI Oil Daily Chart – Consolidation Phase
WTI crude oil continues to consolidate below the 50-day SMA, reflecting ongoing market uncertainty. Prices are currently fluctuating within the $60–$62 range, following a rebound from the $55 support zone.
This sideways action signals hesitation among traders, as the market searches for clear direction. The RSI remains above the midline, hinting that momentum may be building for the next major move.
A confirmed break above $62 and the 50-day SMA could open the way toward the 200-day SMA near $65.
However, as long as prices remain capped below the $65 level, the broader outlook stays cautiously bearish.
⏱️ WTI Oil 4-Hour Chart – Neutral to Slightly Bearish Tone
On the 4-hour timeframe, WTI crude is consolidating just under the $62 resistance zone, showing a lack of conviction from both bulls and bears.
The RSI sits above the 50 level, signaling a neutral tone, but not yet confirming bullish strength.
The market is waiting for a breakout — either above $62 for short-term upside or below $59.80 for renewed bearish pressure.
💡 Technical Summary:
Support: $59.80 / $58.40 / $55.00
Resistance: $62.00 / $63.50 / $65.00
Bias: Neutral-to-Bearish while below $65
Next Move: Watch for breakout confirmation on volume
Latest Posts