07 Aug 2025
🛢️ WTI Crude Oil (CL) Technical Analysis
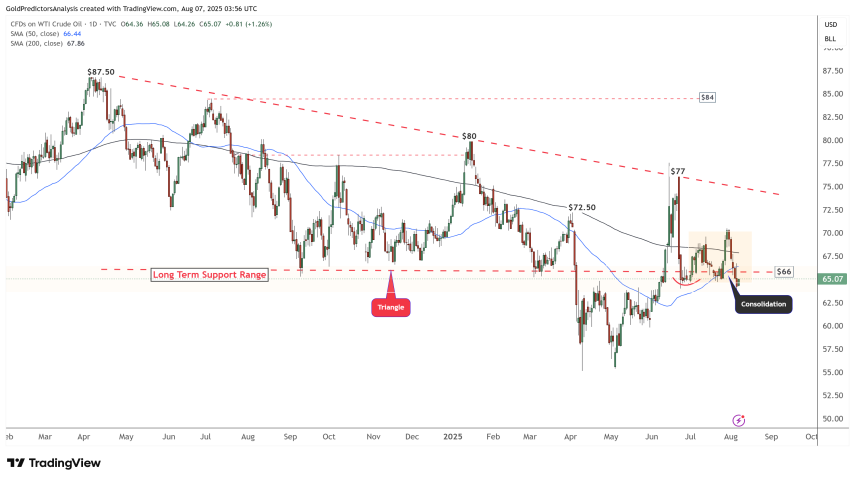
Daily Chart Outlook – Price Stuck in a Key Range
WTI crude oil is currently consolidating in a tight range near the long-term support zone around $66, with no clear breakout in sight. This sideways movement signals indecision in the market, leaning slightly bearish.
A bullish breakout above $77 would likely trigger upside momentum toward the $84 resistance, while a break below $64 could open the door for a sharper decline toward the $60 and $55 levels.
📉 Bias: Bearish unless $77 is broken
📈 Bullish Trigger: Break and close above $77
📉 Bearish Trigger: Break below $64
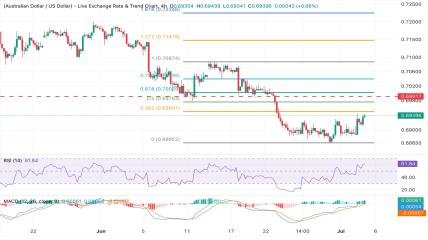
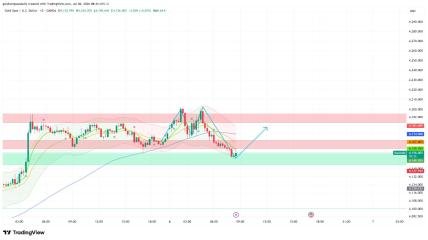
4-Hour Chart Insight – Double Top and Bearish Pressure
Zooming into the 4H timeframe, price action reveals a double top formation, reinforcing the bearish bias. The consolidation zone, highlighted in orange, shows that WTI remains capped below key resistance, and is currently hovering above the $64 mark.
The Relative Strength Index (RSI) reflects continued range-bound momentum, with no clear directional strength. However, a breakdown below $64 would confirm bearish continuation, targeting $60 as the next support.
🔐 Premium Signal Note:
We’re watching WTI closely for a breakout setup. Premium members will get real-time trade signals if this level breaks, with precise entry, stop loss, and take profits.
📩 Not in VIP yet? Join now to never miss high-volatility entries like this.
Latest Posts