10 Jun 2026
🇮🇳 USD/INR Analysis: Symmetrical Triangle Signals a Potential Breakout
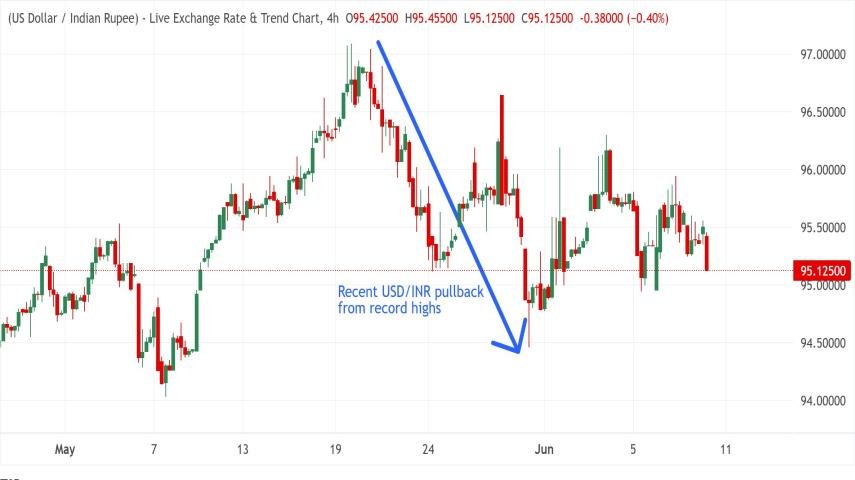
USD/INR is trading near 95.15, remaining trapped within a Symmetrical Triangle pattern, indicating a period of consolidation as buyers and sellers battle for control.
📊 Technical Highlights:
🔹 The pair continues to hover around the 20-period EMA at 95.46, suggesting the short-term trend remains neutral.
🔹 The RSI is fluctuating between 40 and 60, reflecting market indecision and the absence of strong momentum.
🔼 Bullish Scenario
A decisive breakout above the triangle resistance near 96.00 could trigger fresh buying pressure.
🎯 Upside Targets:
✅ 96.00 – Breakout Confirmation
✅ 96.50 – Intermediate Resistance
✅ 97.10 – All-Time High
🔽 Bearish Scenario
Failure to hold above key support levels could expose the pair to a deeper correction.
🎯 Downside Targets:
⚠️ 95.04 – Initial Support
⚠️ 94.49 – Structural Support
⚠️ A sustained break below 94.49 may accelerate bearish momentum.
📌 Market Outlook: USD/INR remains in a wait-and-see mode. Traders should monitor the 96.00 resistance and 95.04 support closely, as a breakout from this compression phase could define the pair's next major move.
⚠️ This analysis is for educational purposes only and should not be considered financial advice. Always use proper risk management when trading.