09 Jun 2026
Gold Price Forecast: XAU/USD Stuck at the Bottom of a Falling Channel
Executive Summary
📉 Bias: Bearish below the 200-day SMA
🛡️ Immediate Support: $4,268
⚠️ Key Downside Levels: $4,220 and $4,100
🚀 Resistance: $4,350–$4,365 and $4,445
🎯 Bullish Recovery Target: $4,540
Technical Analysis
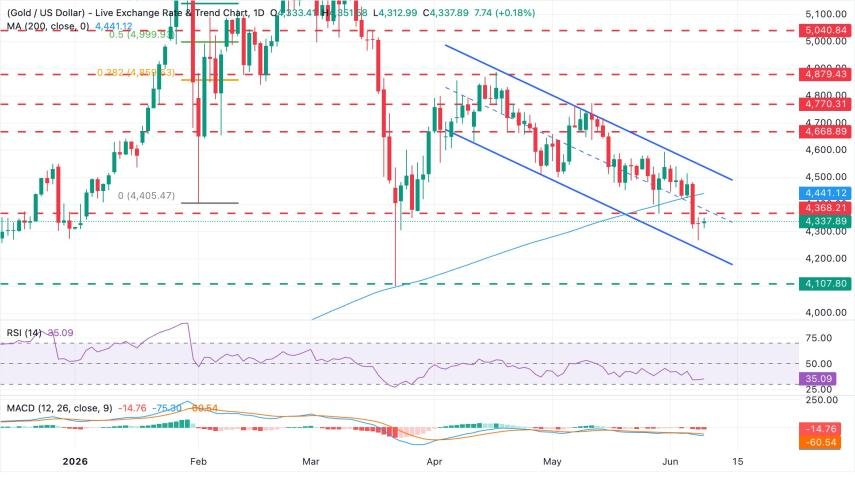
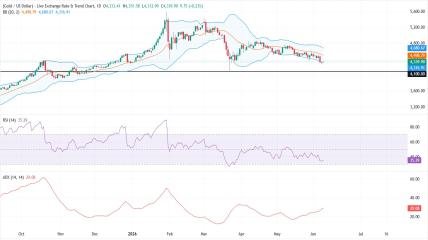
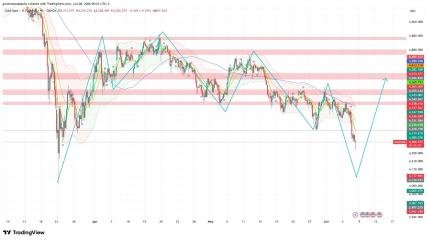
Gold (XAU/USD) continues to trade with a bearish tone after slipping below the critical 200-day Simple Moving Average (SMA) last Friday. The precious metal is currently hovering around $4,337, remaining trapped near the lower boundary of a descending channel that has guided price action in recent sessions.
The failure to reclaim former support around $4,350–$4,365 suggests that sellers remain firmly in control, while the recent low at $4,268 is once again under pressure.
Momentum Indicators Remain Weak
Technical indicators continue to favor the downside.
The Relative Strength Index (RSI) remains in the mid-30s, highlighting weak momentum and limited buying interest. At the same time, the Moving Average Convergence Divergence (MACD) remains deeply in negative territory, reinforcing the view that bearish pressure has yet to fade.
Together, these indicators suggest that any short-term rebounds may struggle unless key resistance levels are decisively reclaimed.
Bearish Scenario: Focus on $4,268
The first level traders should monitor is Monday's low at $4,268.
A break below this support could accelerate losses toward the lower boundary of the descending channel near $4,220. Should bearish momentum intensify, Gold may revisit the year-to-date low around $4,100, a major support zone that could attract fresh buying interest.
Key Support Levels
🛡️ $4,268
🛡️ $4,220
🛡️ $4,100
Bullish Scenario: What Gold Bulls Need
For buyers to regain control, XAU/USD must first reclaim the $4,350–$4,365 region, which coincides with previous swing lows from March and May.
A sustained move above this area would reduce immediate downside pressure. The next major hurdle sits at the 200-day SMA near $4,445. If bulls successfully break above this dynamic resistance, Gold could extend its recovery toward the upper boundary of the descending channel near $4,540.
Key Resistance Levels
🚀 $4,350 – $4,365
🚀 $4,445 (200-day SMA)
🚀 $4,540
Outlook
Gold remains vulnerable as long as it trades below the 200-day SMA and within its falling channel structure. The $4,268 support zone will likely determine the next major move.
A break lower could expose $4,220 and eventually $4,100, while a recovery above $4,365 would be the first indication that bearish momentum is beginning to fade.
Until then, caution remains warranted as sellers continue to dominate the broader technical picture.