04 Nov 2025
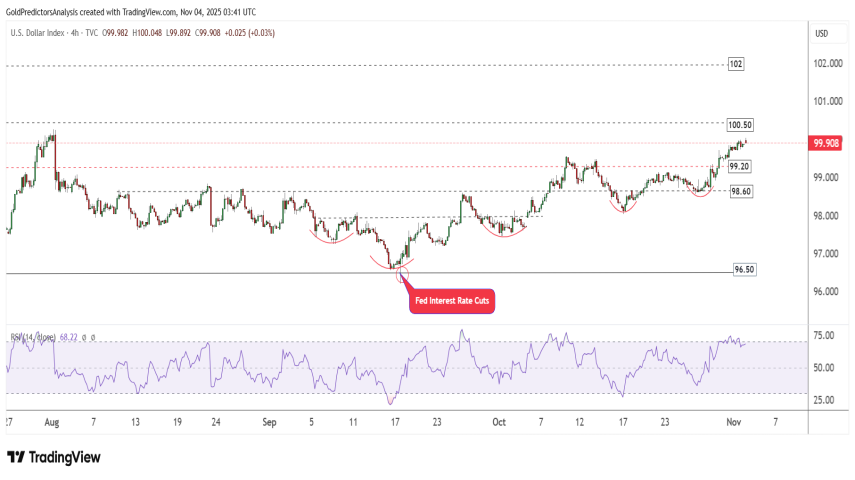
📊 US Dollar Daily Chart – Key Resistance at 100.50
The U.S. Dollar Index continues to trend higher following the Fed’s recent rate cuts. Immediate resistance is visible near 100.50, which coincides with the 50-day SMA — making it a critical level to watch.
The RSI is approaching overbought territory as the index nears the 100 mark. This suggests that respecting this resistance could trigger a sharp pullback in the short term.
A break above 100.50 would confirm a short-term bullish breakout, but for now, caution is warranted as the index tests this key level.
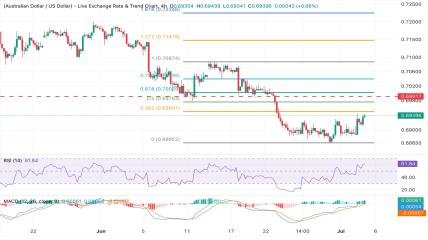
⏱️ US Dollar 4-Hour Chart – Consolidation
On the 4-hour chart, the DXY shows a strong recovery from the 96.50 support level. However, the index is approaching the critical resistance zone at 100.50–101.
A sharp correction from this area is likely, potentially keeping the DXY range-bound in the near term. Despite the recent rebound, the overall trend remains bearish, and traders should monitor for potential pullbacks.
💡 Technical Summary:
Support: 96.50 / 97.50 / 98.50
Resistance: 100.50 / 101.00 / 102.00
Bias: Neutral-to-Bearish while below 100.50
Next Move: Watch for a breakout above 100.50 for bullish momentum or rejection for short-term pullback
Latest Posts