15 Jun 2026
NZD/USD Technical Analysis: Bulls Defend the Breakout
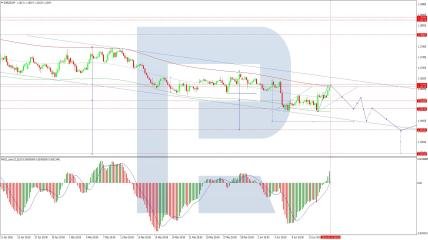
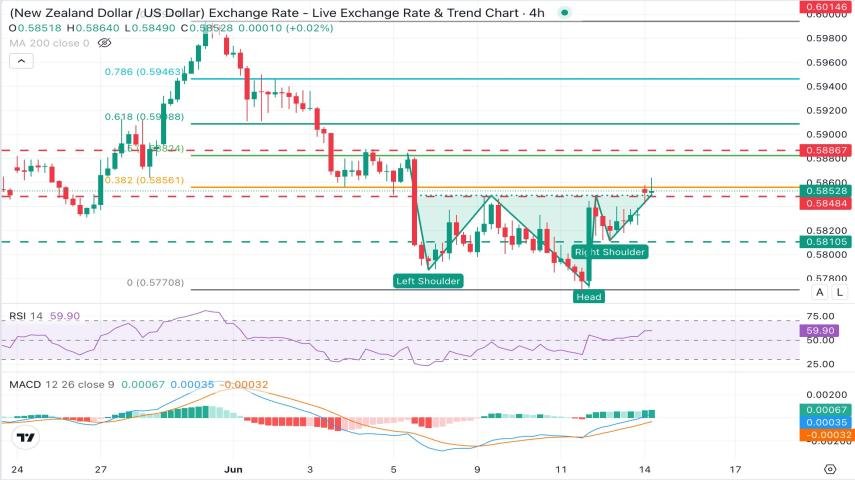
NZD/USD is trading around 0.5852, maintaining a cautiously bullish tone after breaking above the neckline of an inverted Head & Shoulders pattern, a formation often associated with potential trend reversals.
Momentum indicators continue to support the upside outlook. The RSI on the 4-hour chart remains near 60, indicating improving buying pressure, while the MACD stays above its signal line in positive territory, suggesting that bullish momentum is gradually building.
On the upside, immediate resistance is located at the 38.2% Fibonacci retracement near 0.5857. A successful break above this barrier could open the door toward the 0.5890 region, followed by the 61.8% Fibonacci retracement at 0.5910.
On the downside, the neckline support around 0.5845 remains crucial for maintaining the bullish structure. If sellers regain control below this level, the pair could revisit 0.5810, with a deeper decline exposing the 0.5760 support zone.
📌 Key Levels to Watch:
🔹 Resistance: 0.5857 | 0.5890 | 0.5910
🔹 Support: 0.5845 | 0.5810 | 0.5760
As long as NZD/USD holds above the neckline support, the bias favors further upside attempts, although confirmation above nearby resistance is needed to strengthen the bullish case.