07 Aug 2025
🔥 Natural Gas (NG) Technical Analysis
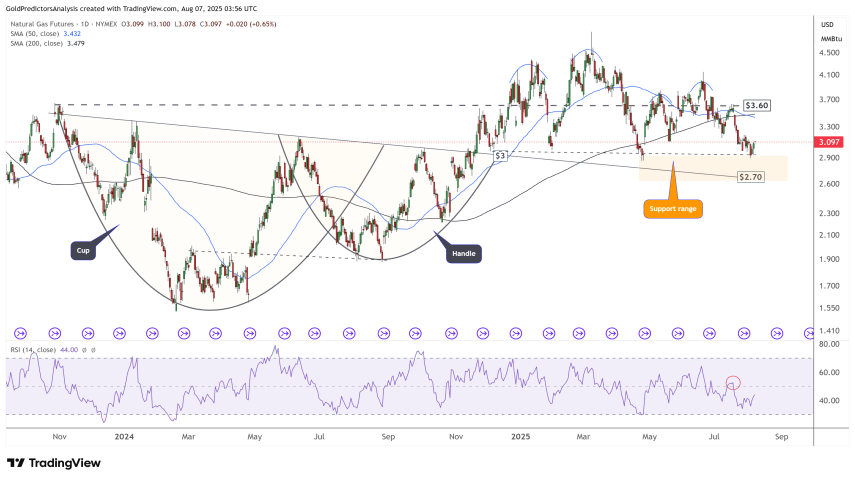
Daily Chart Overview – Strong Support at $3
Natural Gas is holding steady above a critical support zone at $3, after a pullback from the recent high near $3.60. This rebound signals buying interest near key support, and as long as NG stays above $3, the long-term trend remains bullish.
The broader support range between $2.70 and $3 has proven reliable. However, a breakdown below $2.70 would shift sentiment bearish and could open the way toward lower targets.
📉 Bearish Trigger: Break below $2.70
📈 Bullish Continuation: Hold above $3 and break toward $3.60+
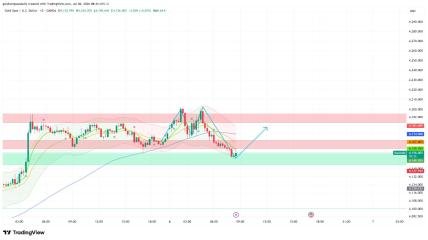
4-Hour Chart View – Bullish Momentum Building
On the 4H chart, Natural Gas is consolidating between $2.90 and $4.70, forming a potential base structure. The recent bounce from $3 suggests growing bullish pressure, with buyers stepping in to defend key zones.
As long as NG trades above $2.90, the outlook remains neutral to bullish. A breakout above $3.60–$3.80 may trigger a move toward $4.50 or even $4.70.
🔐 Premium Signal Note
We’re tracking Natural Gas closely for a breakout trade opportunity. Once confirmed, our VIP members will receive the exact entry, stop loss, and profit targets in real time.
💡 Not in VIP yet? High-probability setups like this are only shared inside our premium group.
🔥 Natural Gas is bouncing off the key $3 level with bullish potential forming!
A break above $3.60 could launch a strong move toward $4.50+. Stay ahead with real-time setups from Gold Scalping Signals.
📲 Premium signals from $25/month
Latest Posts