Nasdaq Elliott Wave Analysis: Climbing the Final Wave of the Rally
Market Overview The Nasdaq 100 continues to trade within a strong bullish trend, extending the rally that began from the March 2026 lows. However, recent price action suggests the market may be entering the final stage of its current Elliott Wave structure. While buyers remain in control, emerging technical signals indicate that the uptrend is becoming increasingly mature, raising the possibility of a corrective phase in the coming weeks.
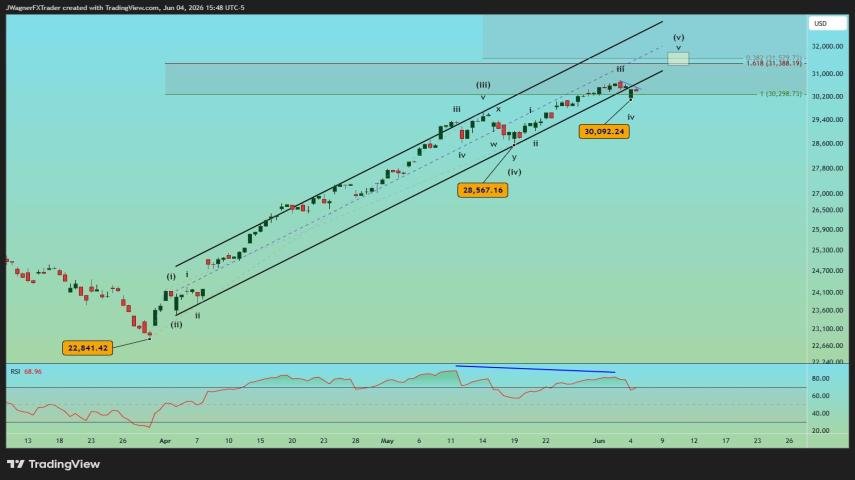
Elliott Wave Structure The advance from the March low appears to be unfolding as a classic five-wave Elliott Wave impulse pattern. The broader structure is labeled: Wave (i) Wave (ii) Wave (iii) Wave (iv) Wave (v)
Current analysis suggests that Nasdaq is now trading within Wave (v), the final wave of the larger bullish sequence. Furthermore, Wave (v) itself appears to be subdividing into its own five-wave structure. This week's low is likely the completion of a smaller fourth wave, indicating that the market may have recently begun Wave v of (v), which is often the final phase of an extended rally.
Upside Targets Based on Fibonacci extension measurements, two major upside objectives remain in focus: 🎯 31,388 Represents the 1.618 Fibonacci extension of Wave (i) 🎯 31,579 Represents the 38.2% extension of Waves (i) through (iii)
This creates a significant resistance zone between 31,388 and 31,579 where traders should expect increased volatility and potential profit-taking activity.
Warning Signs Emerging Although the bullish trend remains intact, several technical developments suggest that momentum may be weakening: A key trendline was recently broken.
Momentum divergence is beginning to appear. The market is approaching major Fibonacci extension targets. Elliott Wave analysis indicates an ending wave structure. These signals do not necessarily mean the rally is over, but they do suggest traders should become increasingly cautious as prices approach resistance.
Key Support Levels The first level traders should monitor is: 📉 30,092 A break below this support would provide an early warning that a larger correction may be developing. Below that, major horizontal support is located near: 📉 28,567 A sustained move below this level would significantly weaken the bullish outlook and increase the probability that a major market top has formed.
Trading Outlook The Nasdaq remains bullish in the near term, and additional gains toward 31,388–31,579 remain possible. However, the current Elliott Wave structure suggests the market is advancing within an ending phase of the trend. Traders should continue respecting the bullish momentum while remaining alert for signs of exhaustion near resistance. As always, risk management remains essential, especially as markets approach key technical turning points.
🔥 STOP ACCOUNT BURNING 📈 BUILD CONSISTENT TRADERS The Mission Never Takes a Break.