07 Aug 2025
🟡 Gold (XAUUSD) Technical Analysis
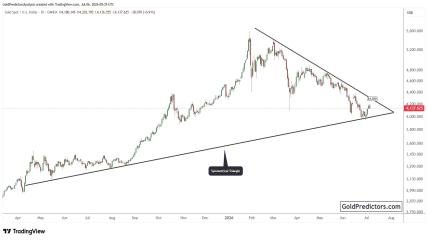
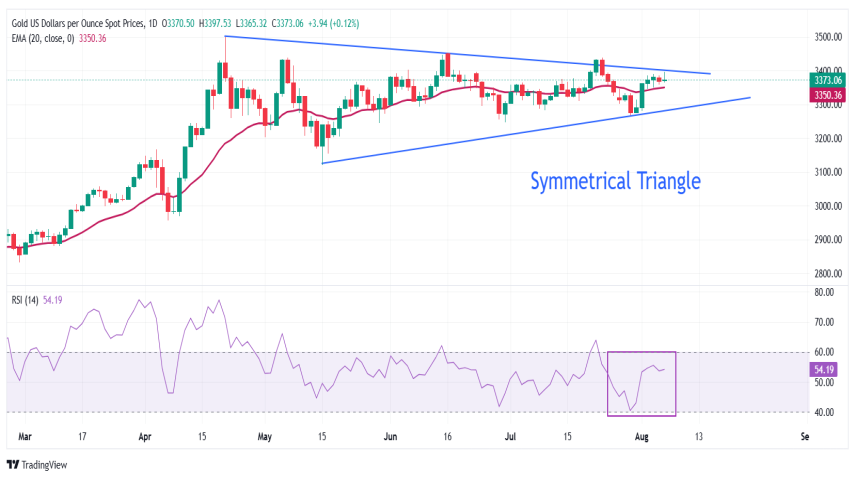
Gold Near Triangle Breakout – Eyes on $3,500
Gold price is currently hovering near the upper boundary of a Symmetrical Triangle, with resistance forming around $3,400, just below April’s high at $3,500. This tightening structure signals a potential explosive breakout is on the horizon.
The lower boundary of this triangle is drawn from May’s low near $3,121, forming a converging pattern that typically resolves in a strong directional move.
📈 Trend Bias:
Gold is holding slightly above the 20-day EMA near $3,350, suggesting a bullish bias in the near term.
📊 RSI Analysis:
The 14-day Relative Strength Index (RSI) remains neutral, oscillating between 40–60, reflecting indecision among market participants — awaiting a breakout catalyst.
🔍 Key Technical Levels
🔼 Bullish Scenario:
A decisive breakout above $3,500 opens the door to uncharted levels
Next resistance targets: $3,550 and $3,600
🔽 Bearish Scenario:
A drop below $3,245 (May 29 low) would invalidate the bullish structure
Support levels to watch: $3,200 and $3,121 (May 15 low)
🔐 Premium Signal Note
We’re closely tracking this triangle breakout for a high-volatility entry. VIP members will be alerted instantly once confirmation is triggered — with exact entry, stop loss, and multiple take profits.
Not in VIP yet? You’re missing premium setups like this one — every single week.
Latest Posts