08 Aug 2025
Gold Faces Rejection Near Channel Resistance; $3,385 Breakout in Focus
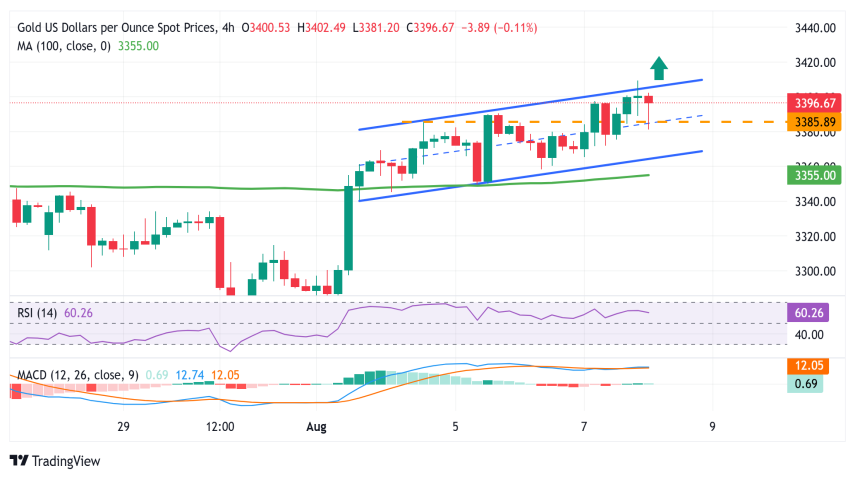
Gold prices attempted an overnight breakout above the $3,383–$3,385 resistance zone, signaling bullish momentum backed by favorable daily chart oscillators. However, during the Asian session, the rally lost steam near the upper boundary of a long-term ascending channel — a key technical ceiling.
While the bullish structure remains intact, prudent traders may prefer confirmation through follow-through buying beyond the $3,309–$3,310 intraday resistance before targeting higher levels. A clear breakout above this pivot could open the door toward the $3,422–$3,423 barrier, followed by the $3,434–$3,435 resistance. Sustained strength above these zones would likely set the stage for a renewed challenge of the all-time high near $3,500, last seen in April.
🔁 Key Levels to Watch:
Immediate Resistance: $3,310 / $3,423 / $3,435
Critical Breakout Zone: $3,383–$3,385
Support Zone: $3,350–$3,353 (200-period SMA – 4H)
Downside Targets: $3,315 / $3,300 / $3,268
⚠️ Bearish Scenario:
A dip back below the $3,383–$3,385 breakout zone may trigger profit-taking but could present fresh buying opportunities, particularly around the $3,350–$3,353 support zone, which coincides with the 200-SMA on the 4H chart. A decisive break below this level may signal a trend shift, exposing the metal to further downside toward $3,300, or even the $3,268 low registered last week.
🔐 Get VIP Access Now
💹 This is a high-volatility zone with significant breakout potential. Our premium members already received the buy zone alert near $3,353!
✅ Don’t miss the next move — upgrade to VIP and unlock real-time scalping signals, SL/TP levels, and expert intraday setups.
Latest Posts