08 Apr 2026
📊 DXY Market Update — Dollar Under Pressure
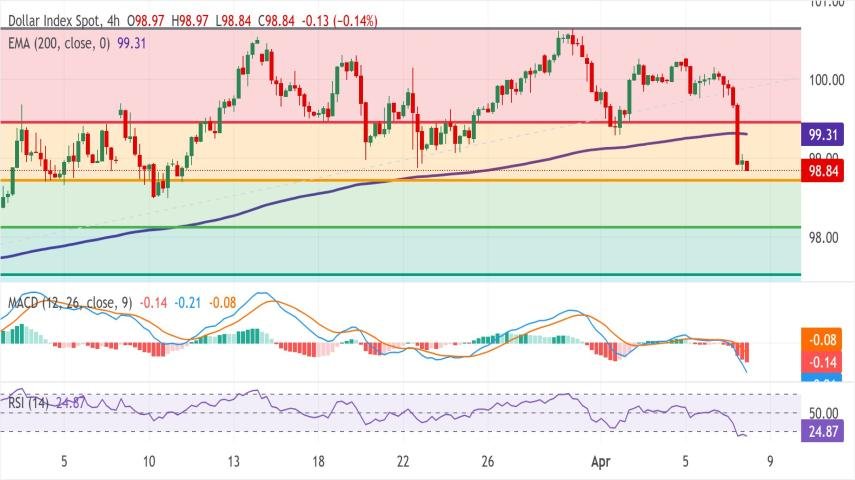
The US Dollar Index (DXY) is trading under strong selling pressure, falling below the 99.00 level and reaching a near one-month low around 98.80.
🌍 Fundamental Drivers
✅ Markets shifted into risk-on sentiment after signals of a US–Iran two-week ceasefire, reducing demand for the safe-haven US dollar.
✅ The reopening of the Strait of Hormuz pushed crude oil prices sharply lower, easing global inflation concerns.
✅ Lower inflation expectations reduced bets on aggressive Federal Reserve rate hikes, adding further downside pressure on USD.
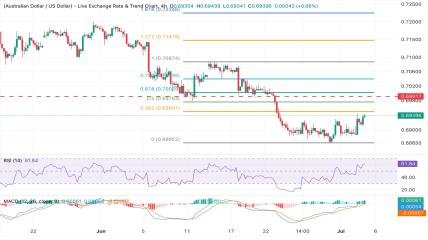
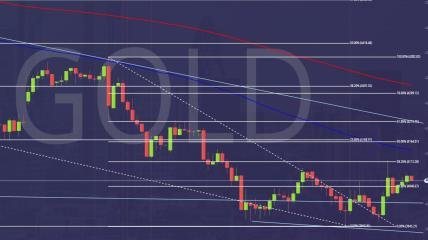
📉 Technical Outlook (4H Chart)
Price broke below the 23.6% Fibonacci retracement of the January–March rally.
DXY also moved under the 200 EMA, a bearish signal.
MACD shows increasing downside momentum.
RSI is near oversold levels, meaning selling pressure remains strong but a short-term bounce is possible.
🔑 Key Levels to Watch
Support
98.72 → 38.2% Fibonacci level
98.13 → 50% Fibonacci level (next bearish target)
Resistance
99.30 → 200 EMA
99.46 → Key recovery level
100.00 → Psychological resistance
🧭 Trading Bias
📉 Bearish below 99.46
📈 Recovery only confirmed above 100.00
Latest Posts