04 Nov 2025
🛢️ Brent Crude Oil Technical Analysis
📊 Brent Oil Daily Chart – Descending Broadening Wedge
Brent crude oil continues to trade within a descending broadening wedge pattern that has persisted since 2024. Strong long-term resistance sits near $75, and a break above this level is needed to trigger further upside momentum.
On the downside, a break below $60 would intensify bearish pressure. Overall, the outlook remains negative while prices are suppressed below the $75 resistance zone.
⏱️ Brent Oil Weekly Chart – Bearish Pressure Persists
The weekly chart shows Brent consolidating below the black trendline near $75. Prices remain under the 50-day SMA, reflecting market uncertainty.
The RSI is below the midline, signaling that bearish pressure dominates. A break below $60 would reinforce the downtrend and confirm further downside potential.
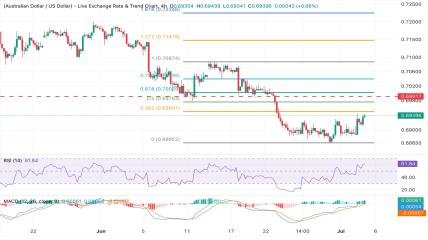
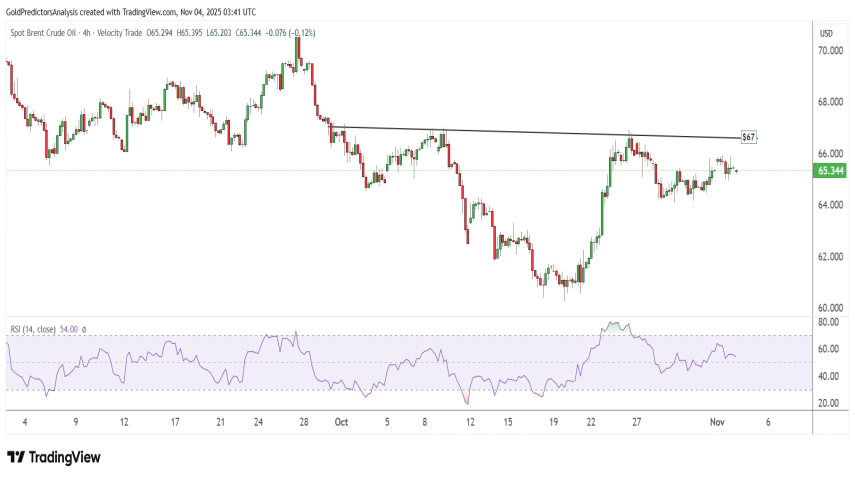
⏱️ Brent Oil 4-Hour Chart – Rebound Under Watch
On the 4-hour chart, Brent is consolidating below $67, searching for its next move.
The rebound from $60 appears constructive.
A break above $67 would signal potential upside toward $70.
As long as Brent trades below $67, the short-term bias remains bearish.
💡 Technical Summary:
Support: $60.00 / $58.00 / $55.00
Resistance: $67.00 / $70.00 / $75.00
Bias: Bearish while below $67/$75
Next Move: Watch for breakout confirmation above $67 or breakdown below $60
Latest Posts