📊 Gold Price Forecast: XAU/USD Risks Further Decline Below the $4,000 Support Zone
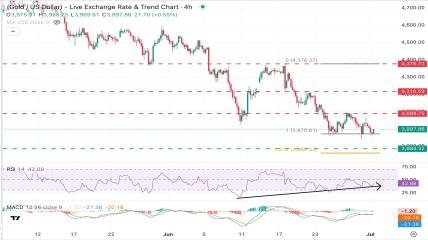
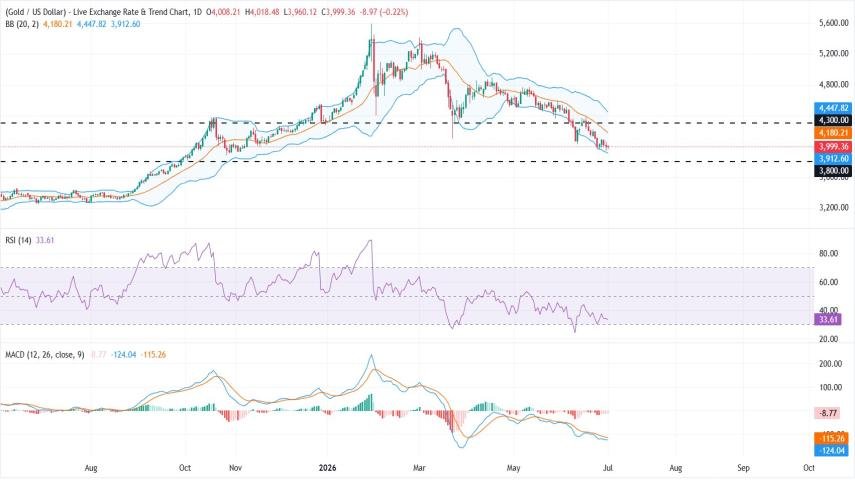
Gold (XAU/USD) continues to trade with a bearish bias as prices remain below the key 20-day Simple Moving Average (SMA) near $4,180. Despite showing oversold conditions, sellers continue to dominate the market, keeping the risk of further downside firmly in focus. The precious metal is now testing critical support levels, and a decisive breakdown could trigger another wave of selling pressure.
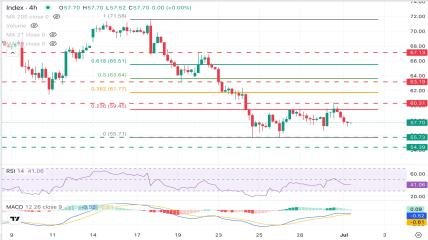
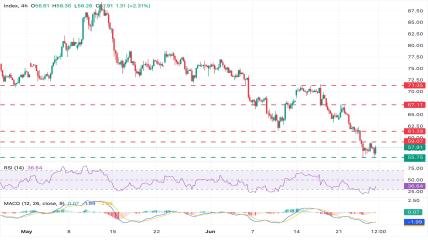
📉 Technical Analysis Gold remains under pressure after failing to reclaim higher resistance levels. Technical indicators continue to support the bearish outlook: RSI (14): Trading in the low-30 region, indicating oversold conditions but without confirming a bullish reversal. MACD: Remains below the zero line, reflecting persistent bearish momentum. Although oversold conditions could produce short-term rebounds, the overall trend remains negative while price stays below the 20-day SMA.
🟢 Key Support Levels $3,911 – Lower Bollinger Band support $3,800 – Major horizontal support A break below $3,911 would increase the probability of a move toward $3,800, where stronger buying interest may emerge.
🔴 Key Resistance Levels $4,180 – 20-day SMA $4,300 – Horizontal resistance $4,450 – Major supply zone A sustained move above $4,180 would be the first sign of improving momentum, while a break above $4,300 would strengthen the case for a broader recovery.
📊 Market Outlook Gold remains vulnerable below the $4,180 resistance zone. The prevailing bearish trend suggests that rallies may continue to attract sellers unless buyers reclaim key resistance levels. Traders should closely monitor the $3,911 support, as a decisive breakdown could accelerate losses toward $3,800.